


- Ethereum’s price reclaimed $2,350, with technical indicators supporting a potential rally towards $3,260
- Altcoin’s netflow analysis alluded to shifting market sentiment
Ethereum’s price action has captured the attention of traders lately, with key indicators hinting at the potential for a strong upward move. In fact, the crypto has exhibited resilience, reclaiming critical price levels and demonstrating patterns that historically precede rallies.
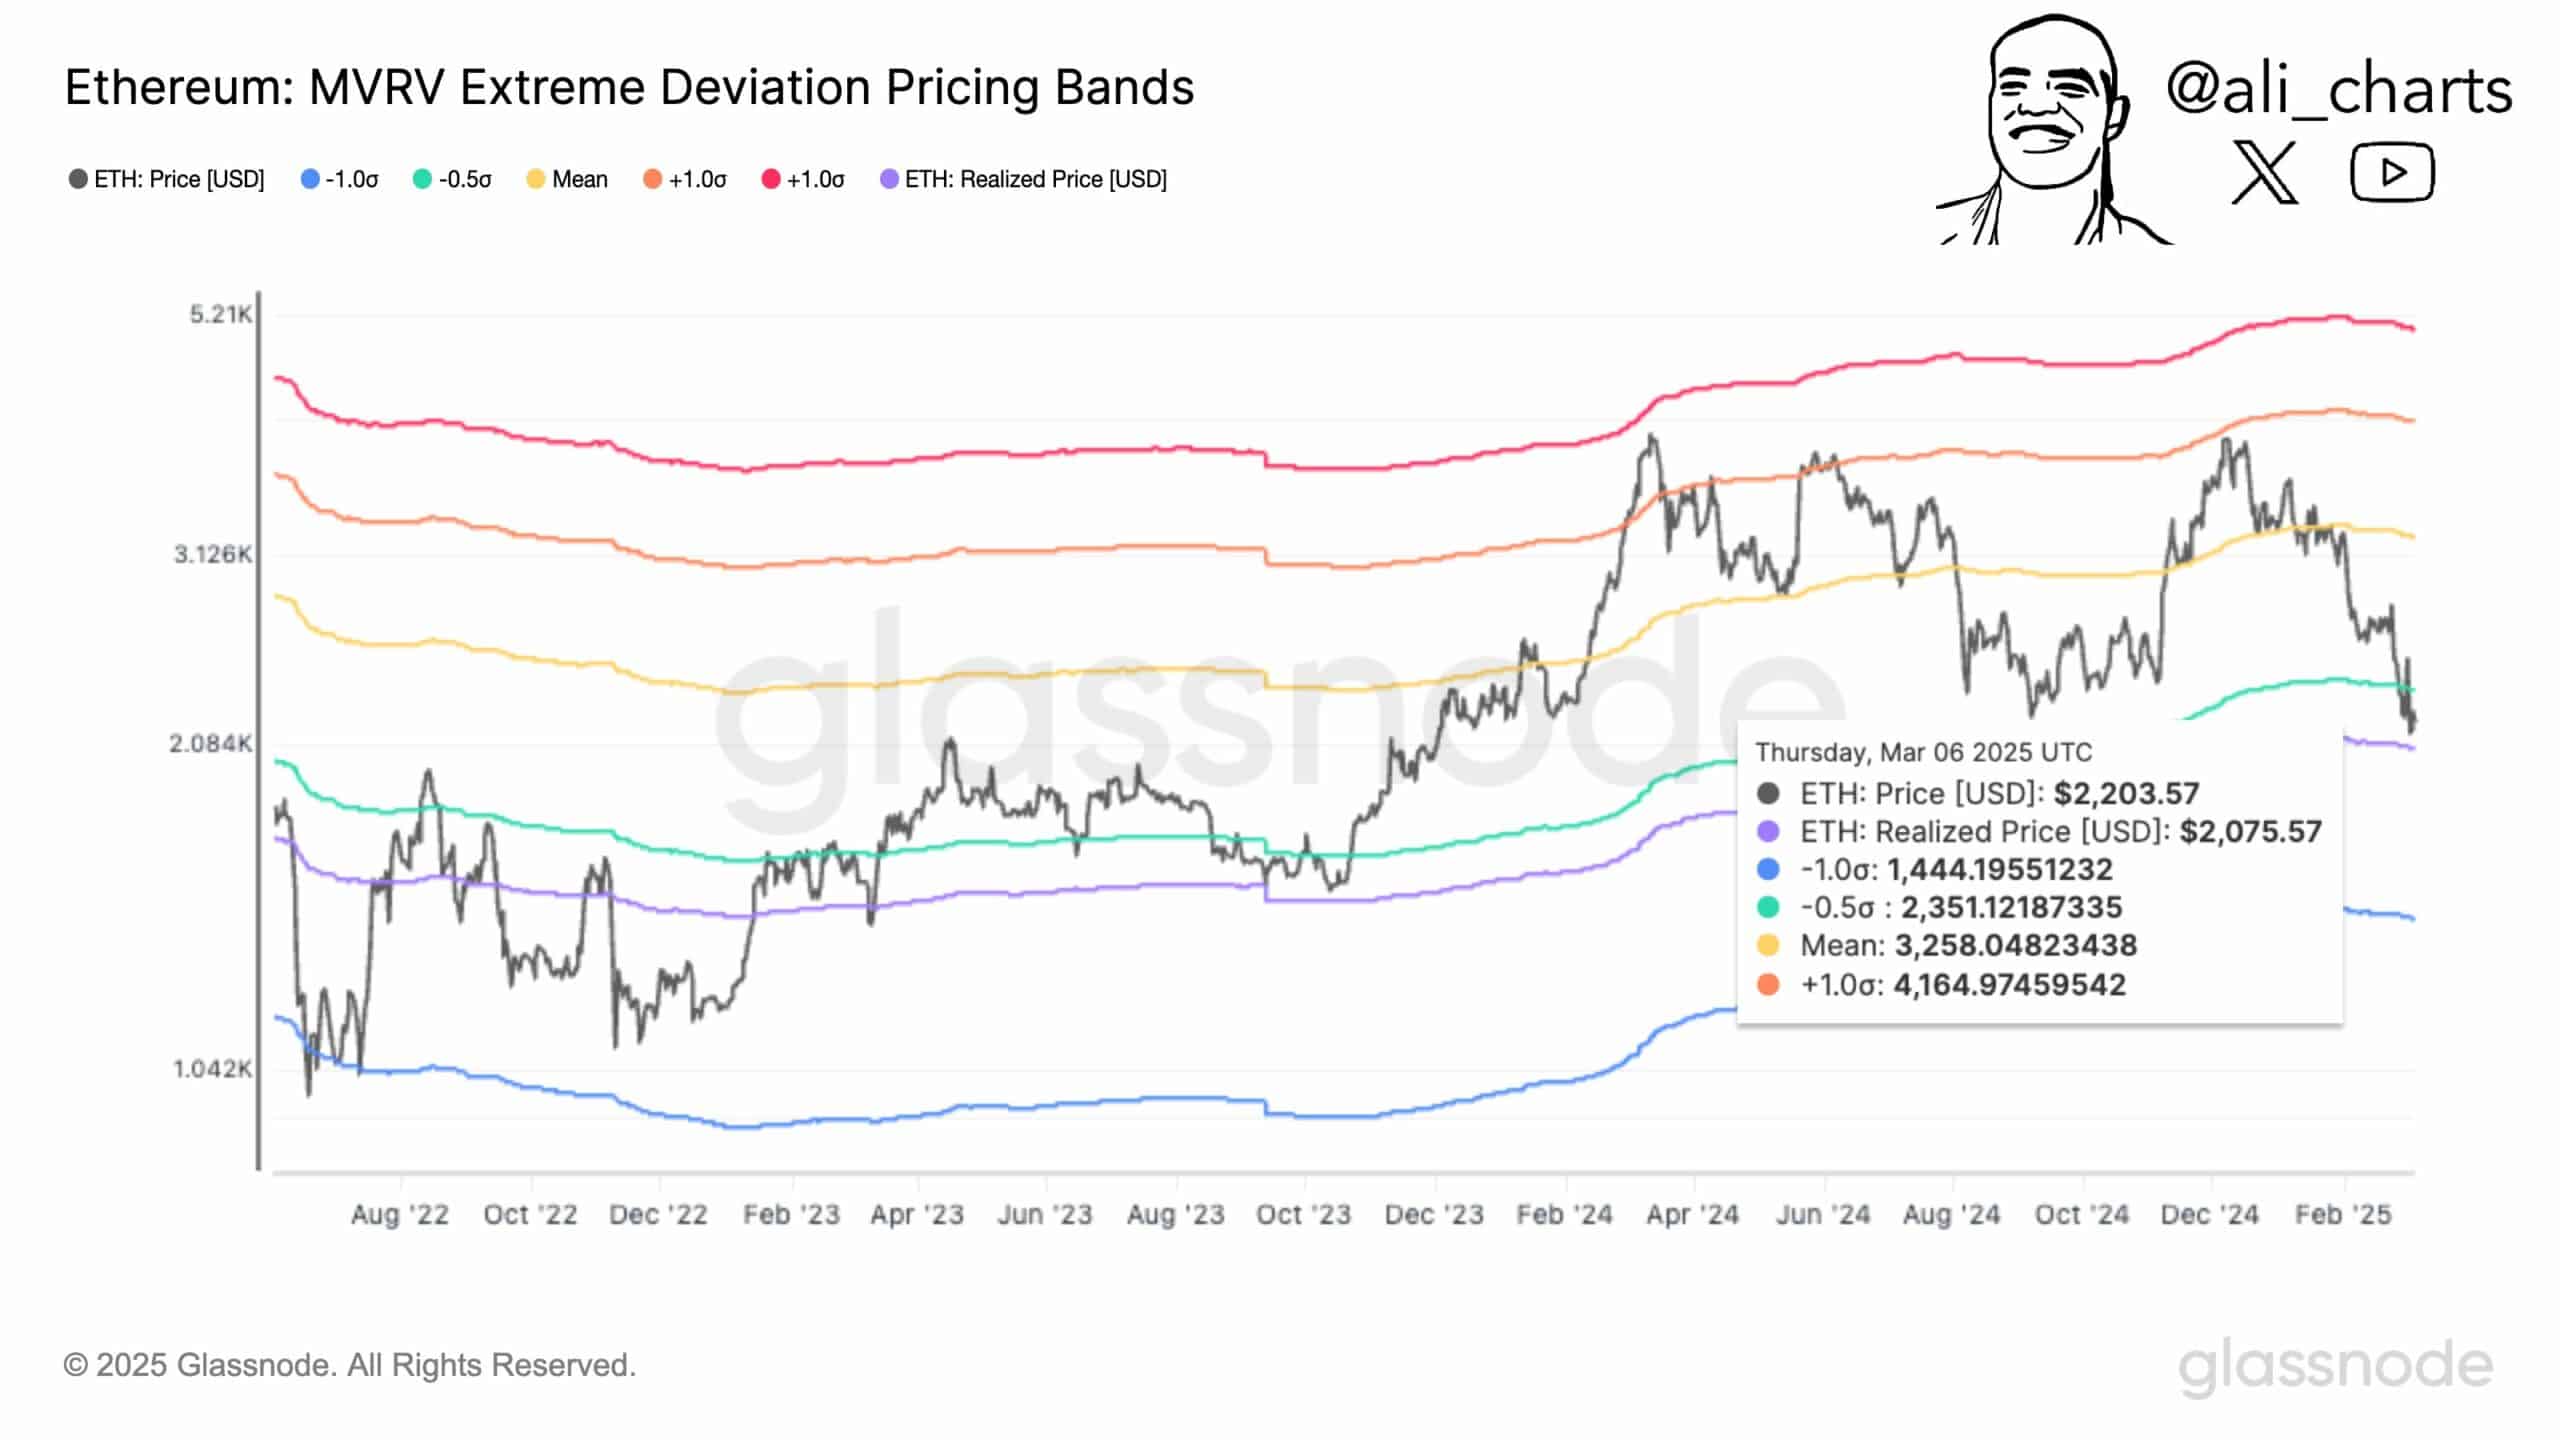
Ethereum[ETH] reclaimed $2,350 on the charts, with technical indicators supporting a potential rally towards $3,260. On 6 March, ETH was trading at $2,203.57, with the realized price at $2,075.57.
The altcoin’s pricing bands identified key levels, with ETH breaking above a crucial threshold – A sign of strong bullish momentum.
Source: Glassnode
Historical trends revealed that similar breakouts led to price surges, such as the rise from $1,042k in August 2022 to $3,126k by August 2024. This pattern suggested that ETH’s latest move alluded to accumulation and reduced selling pressure.
Hence, a rally to $3,260 might be feasible, offering a potential 48% upside. However, failure to hold $2,351 could push ETH down to $1,444 – A possible 34% decline.
Exchange withdrawals – Meaning?
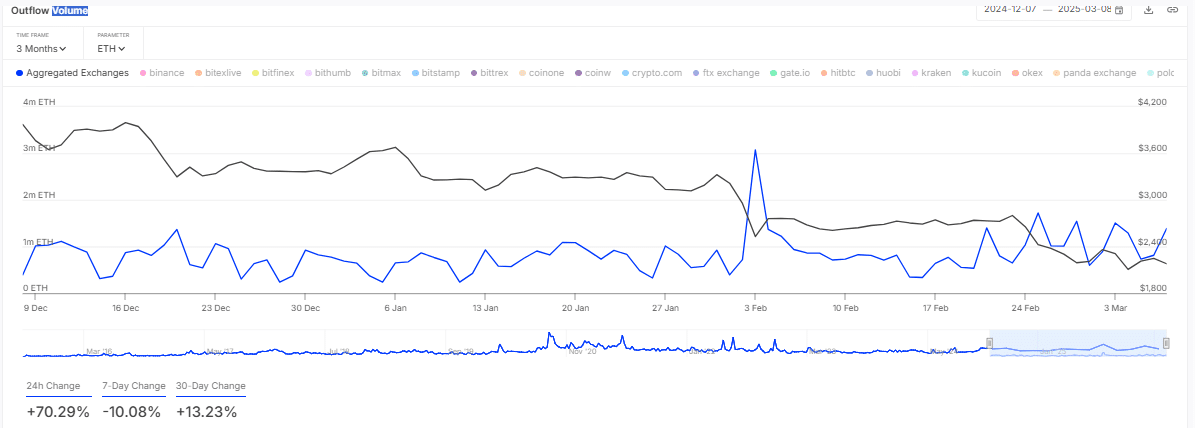
Over $500 million worth of ETH was withdrawn from exchanges, indicating an uptick in accumulation among traders. The outflow volume chart on 8 March showed a 24-hour change of +70.29% – A 7-day change of -10.08% and a 30-day hike of +13.23%.
Source: IntoTheBlock
3 March’s outflows peaked at 1 million ETH, valued at $2.4 billion, before declining to 400k ETH by 6 March. The sharp 24-hour surge reflected strong buying pressure, reducing available supply on major exchanges.
The 30-day trend reinforced the long-term accumulation pattern, often a precursor to price hikes. However, the 7-day decline pointed to short-term profit-taking, which could momentarily slow momentum.
This pattern resembled early 2024 when outflows preceded a 20% price jump. If outflows continue, ETH could move towards $2,600. Conversely, if selling pressure returns, ETH might retest $2,200 on the charts.
Bearish signals amid outflow trends
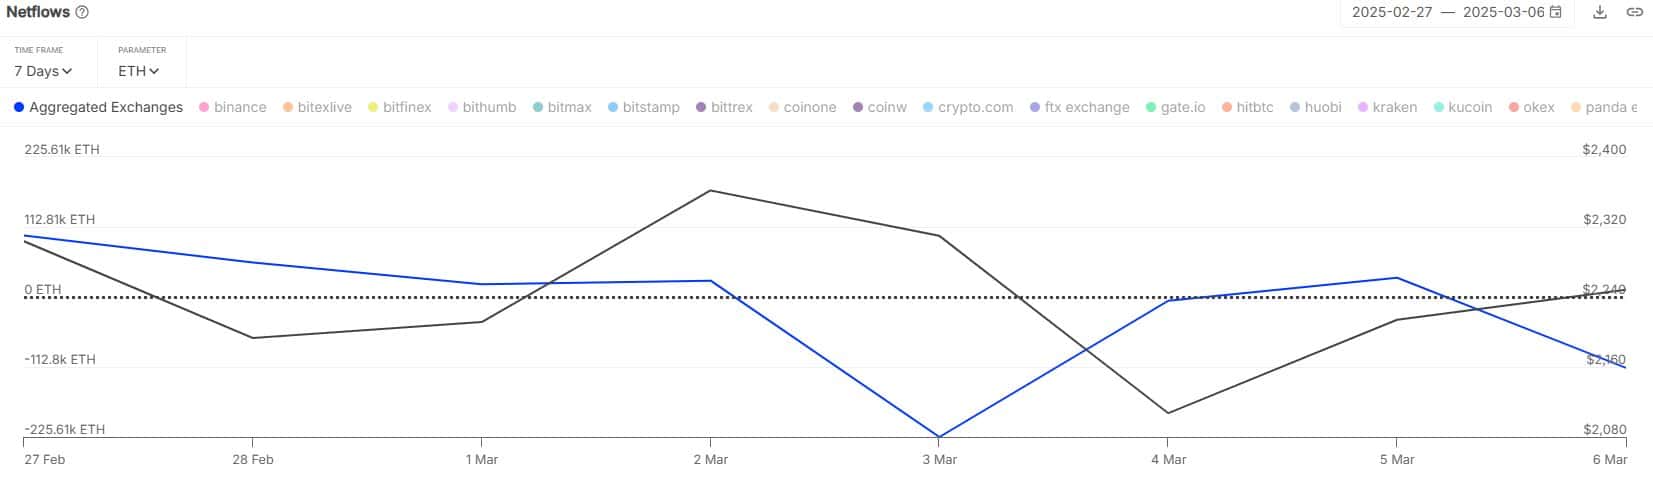
Ethereum’s netflow analysis highlighted shifting market sentiment.
Source: IntoTheBlock
Net outflows peaked at -225.61K ETH on 5 March, equivalent to $540 million at $2,400 per ETH, before reducing to -112.81K ETH the next day. The 7-day and 30-day netflow declines indicated ongoing accumulation, reducing available supply on platforms like Coinbase and Kraken.
This trend historically preceded rallies, as seen in February 2024, when a similar outflow pattern led to a 15% price hike. If sustained, this trend could push ETH to $2,800. However, if inflows surge, selling pressure could push ETH to $2,100 – Signaling a possible reversal.
A bullish horizon for the altcoin?
At the time of writing, Ethereum’s trajectory appeared bullish, driven by strong technical indicators and accumulation trends. ETH was trading at $2,203.57, with projections hinting at a potential hike to $3,260 – Marking a 48% increase.
Exchange withdrawals also climbed to 400k ETH, valued at $960 million, while netflows remained negative and reinforcing reduced selling pressure. Historically, ETH surged by 20% in 2024 following similar patterns, supporting a move towards $2,800 by mid-March.
If ETH holds firm above $2,351, further upside might be likely. A drop below $2,200, however, might indicate a correction towards $1,444, reflecting a potential 34% decline.